Getting an apartment found by AI starts with the basics: make the property public, crawlable, easy to understand, and consistent across the web.

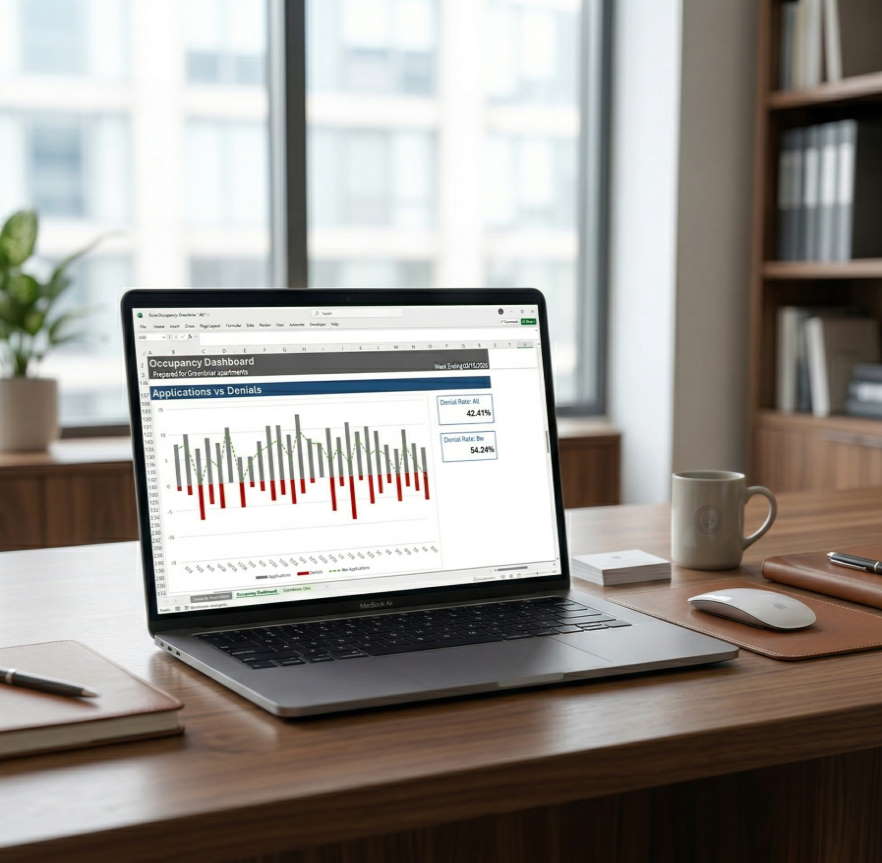
The Dashboard XLS is designed to help you quickly see the numbers that matter most when managing apartment occupancy. In this video, I walk you through the spreadsheet step by step so you can understand how it works, how to load the sample data, and how to begin using it with your own property data.
You’ll see how the dashboard is structured, what each section is showing you, and how the charts help reveal the real story behind your occupancy performance. I also explain how to replace the sample data with your own numbers so your team can start using the dashboard as a practical weekly management tool.
Whether you are opening the file for the first time or preparing to use it with a live property, this video will help you get up to speed faster and avoid common mistakes.
The Dashboard XLS is not just a spreadsheet. It is a practical management tool built to help owners, asset managers, and property teams make occupancy more visible, more measurable, and easier to improve.
Watch the video to see exactly how to use it.

Getting an apartment found by AI starts with the basics: make the property public, crawlable, easy to understand, and consistent across the web.

Asking “What’s blocking you?” helps leaders quickly uncover the real bottlenecks, support their team more effectively, and turn hidden friction into forward progress.

Download AI scripts to capture your weekly data and load it into your Dashboard

Nathan R,
Asset Manager